| motion_labhayleyglassic.doc |
Lab: Interpreting and Matching
Displacement vs. Time Motion Graphs
Objectives:
Displacement vs. Time Motion Graphs
Objectives:
- Create a Displacement vs. Time graph and match your graph with actual motion.
- Gain competence in the use of motion detector and related equipment.
- Understand the relationship between position vs. time, velocity and acceleration.
Materials:
TI-84 Calculator-Based Lab Unit (CBL-II)
Motion detector
Meter stick
Computer with LoggerPro software
Procedure:
Part I –
1. Develop a position vs. time story that describes a body in motion incorporating at least the following four types of motion.
i. standing still
ii. moving with constant velocity
iii. moving with variable negative velocity
iv. moving with variable positive velocity
2. Illustrate the story on a position vs. time graph. Use a legend to cross reference sections of the graph with the corresponding sections of the story.
3. Underneath the graph, write instructions for moving in front of the motion detector according to the graph you have drawn (see page 2 for example).
Part II – AT THE LAB STATION IN CLASS WITH A PARTNER
4. Measure out and mark meaningful locations on the floor and practice the motion needed to create the position vs. time graph.
5. Now it’s time for you to match your physical motion to your group’s descriptive motion graph. You have 3 attempts to match it as best you can. Save a copy best graph your motion creates and reproduce this graph using.....
Data:
Story Instructions:
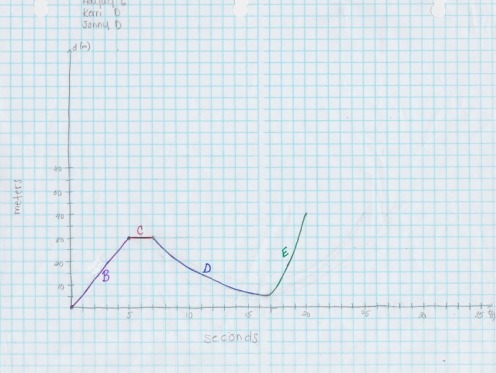
Spiderman is walking down the road for 30 meters for 5 seconds. A group of robbers approaches him. He is not in his leotard, so they mistake him for a normal person without superpowers. In awe of the fact that they would challenge him for his money, Spiderman stops dead in his tracks for 2 seconds. Realizing what he must do, Spiderman backs up slowly and increases his speed backwards for 25 meters for 10 seconds. Ready now to get a running start, he sprints directly into the robbers for 10 meters and it takes him 3 seconds.
GRAPH OF STORY
DISTANCE VERSUS TIME
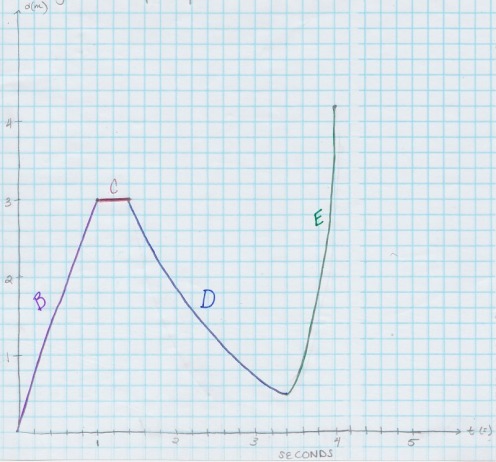
Motion Instructions: (1 Meter in Lab = 10 Meters in Story; 1 Second in Lab = 5 Seconds in Story)
A) Start with your chest 4 cm from the sensor.
B) Walk backward at a constant rate for 3 meters in 1 second.
C) Stop for 0.4 seconds.
D) Walk towards the sensor with a negative acceleration for 2.5 meters in 2 seconds.
E) Walk away from the sensor with a positive acceleration for 3.5 meters in 0.6 seconds.
PROJECTED MOTION DETECTOR GRAPH
DISTANCE VERSUS TIME
Motion Detector Graph and Data:
0 0.106066
0.1 0.140495
0.2 0.193806
0.3 0.253502
0.4 0.325138
0.5 0.408436
0.6 0.495343
0.7 0.585026
0.8 0.660827
0.9 0.737183
1 0.815483
1.1 0.902945
1.2 0.994017
1.3 1.10536
1.4 1.21476
1.5 1.30194
1.6 1.35497
1.7 1.40662
1.8 1.45687
1.9 1.49713
2 1.53517
2.1 1.54628
2.2 1.53795
2.3 1.51074
2.4 1.46465
2.5 1.40662
2.6 1.33332
2.7 1.25557
2.8 1.1359
2.9 1.00873
3 0.89767
3.1 0.810207
3.2 0.72691
3.3 0.654719
3.4 0.588636
3.5 0.531161
3.6 0.457581
3.7 0.393164
3.8 0.342631
3.9 0.30598
4 0.29293
4.1 0.309867
4.2 0.360123
4.3 0.461468
4.4 0.600575
4.5 0.795769
4.6 0.978746
4.7 1.17949
4.8 1.41939
4.9 1.64346
2.7 1.25557
2.8 1.1359
2.9 1.00873
3 0.89767
3.1 0.810207
3.2 0.72691
3.3 0.654719
3.4 0.588636
3.5 0.531161
3.6 0.457581
3.7 0.393164
3.8 0.342631
3.9 0.30598
4 0.29293
4.1 0.309867
4.2 0.360123
4.3 0.461468
4.4 0.600575
4.5 0.795769
4.6 0.978746
4.7 1.17949
4.8 1.41939
4.9 1.64346
GRAPH FOR MOTION DETECTOR
DISTANCE VERSUS TIME
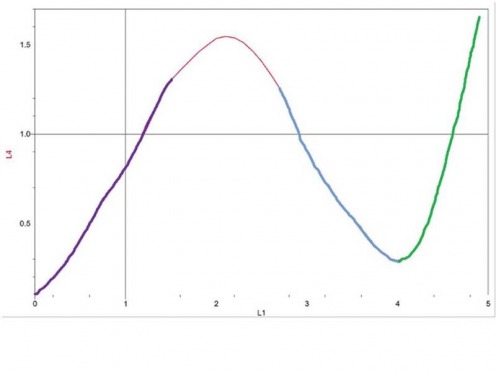
Data Analysis: Discuss differences between the descriptive graph and the graph generated by the motion detector. What are the reasons for the differences?
The descriptive graph and the graph generated by the motion detector had many differences. The descriptive graph could not be fully achieved because of the limitations of reality and motion of the human body. The “still” section of the descriptive graph cannot be simulated in reality because a body over the limited time interval needed cannot have zero movement. The calculator had a limited storage space of the data collected from the motion detector, therefore, we had to bind our experiment to a maximum of five seconds. In order to have the correct ratio of time in reality to time in the story, we would have to stay still for only 0.4 seconds. Since this lab also required movement before and after the motionless period, the body was actually in constant motion. The graph then showed a curve for the interval there should be a horizontal line.
The graph developed by the motion detector was also incorrect because of the distance moved during the lab. The body in motion did not move in both the positive and negative directions in the correct intervals. The motion detector’s graph is bound to 1.7 meters, while its maximum should be 4 meters. This also greatly changed the projection of the motion detector’s graph. It is inaccurately matched to the descriptive graph’s scale which is: 1 Meter in Lab = 10 Meters in Story; 1 Second in Lab = 5 Seconds in Story. However, he “constant” velocity line is almost perfectly achieved in reality by the body in motion as well as the movement with variable positive and negative velocity, but under the wrong distance variable.
Conclusion: Develop a conclusion that addresses the objectives of the lab.
I am now able to interpret the measurements that we used in the story and plot them to create a displacement versus time graph. Actual motion cannot truly match the displacement versus time graph because of the limitation of the human body’s movement. This lab was designed to prove that not every graph can be simulated in reality without the aid of computer movement. The actual motion graph may also vary if the body does not use the total time allotted or the correct displacement. I can now assemble the motion detector and equipment so that the calculator can record the data and create a graph. The calculator must be properly set up so that the x- values or the time corresponds with the amount of time you will be collecting data. The graph and data can then be uploaded to LoggerPro to be analyzed. By interpreting the graphs and data, I am able to understand the relationship between position versus time, velocity and acceleration. The position or displacement versus time shows the changes in velocity over a specific interval of time. For example, when the position versus time graph shows a constant slope, the velocity is zero. To achieve the movement with negative variable velocity, you must have a changing negative acceleration that is variable. As the curve for positive variable velocity is simulated, the body must have a variable positive acceleration. Acceleration is the velocity of an object over time. The velocity changes due to the displacement and acceleration changes due to velocity. Therefore, if you change your displacement, you change the acceleration. This lab proves that not all variable motion can be simulated in reality, but any displacement versus time can be graphed.
